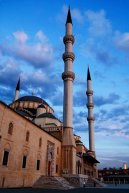
| Introduction - Turkey: |
| Location - Turkey: |
| People - Turkey: |
| Government - Turkey: |
| Economy - Turkey: |
Economy overview | Turkeys dynamic economy is a complex mix of modern industry and commerce along with a traditional agriculture sector that still accounts for more than 35% of employment. It has a strong and rapidly growing private sector, yet the state still plays a major role in basic industry, banking, transport, and communication. The largest industrial sector is textiles and clothing, which accounts for one-third of industrial employment; it faces stiff competition in international markets with the end of the global quota system. However, other sectors, notably the automotive and electronics industries, are rising in importance within Turkeys export mix. Real GNP growth has exceeded 6% in many years, but this strong expansion has been interrupted by sharp declines in output in 1994, 1999, and 2001. The economy is turning around with the implementation of economic reforms, and 2004 GDP growth reached 9%, followed by roughly 5% annual growth from 2005-06. Inflation fell to 7.7% in 2005 - a 30-year low but climbed back to 9.8% in 2006. Despite the strong economic gains from 2002-06, which were largely due to renewed investor interest in emerging markets, IMF backing, and tighter fiscal policy, the economy is still burdened by a high current account deficit and high debt. Prior to 2005, foreign direct investment (FDI) in Turkey averaged less than $1 billion annually, but further economic and judicial reforms and prospective EU membership are expected to boost FDI. Privatization sales are currently approaching $21 billion. Oil began to flow through the Baku-Tblisi-Ceyhan pipeline in May 2006, marking a major milestone that will bring up to 1 million barrels per day from the Caspian to market. |
|
Gdp purchasing power parity | $635.6 billion (2006 est.) |
|
Gdp official exchange rate | $358.5 billion (2006 est.) |
|
Gdp real growth rate | 5.3% (2006 est.) |
|
Gdp per capita ppp | $9,000 (2006 est.) |
|
Gdp composition by sector | agriculture: 11.2%
industry: 29.4%
services: 59.4% (2006 est.) |
|
Labor force | 24.8 million
note: about 1.2 million Turks work abroad (2006 est.) |
|
Labor force by occupation | agriculture: 35.9%
industry: 22.8%
services: 41.2% (3rd quarter, 2004) |
|
Unemployment rate | 10.2% plus underemployment of 4% (2006 est.) |
|
Population below poverty line | 20% (2002) |
|
Household income or consumption by percentage share | lowest 10%: 2.3%
highest 10%: 30.7% (2000) |
|
Distribution of family income gini index | 42 (2003) |
|
Inflation rate consumer prices | 9.8% (2006 est.) |
|
Investment gross fixed | 20.1% of GDP (2006 est.) |
|
Budget | revenues: $112.3 billion
expenditures: $121.6 billion; including capital expenditures of $NA (2006 est.) |
|
Public debt | 64.7% of GDP (2006 est.) |
|
Agriculture products | tobacco, cotton, grain, olives, sugar beets, pulse, citrus; livestock |
|
Industries | textiles, food processing, autos, electronics, mining (coal, chromite, copper, boron), steel, petroleum, construction, lumber, paper |
|
Industrial production growth rate | 5.5% (2006 est.) |
|
Electricity production | 143.3 billion kWh (2004) |
|
Electricity consumption | 140.3 billion kWh (2005) |
|
Electricity exports | 1.1 billion kWh (2004) |
|
Electricity imports | 500 million kWh (2004) |
|
Oil production | 50,000 bbl/day (2005 est.) |
|
Oil consumption | 715,100 bbl/day (2005 est.) |
|
Oil exports | 112,600 bbl/day (2004) |
|
Oil imports | 724,400 bbl/day (2004) |
|
Oil proved reserves | 300 million bbl (1 January 2005) |
|
Natural gas production | 688 million cu m (2004 est.) |
|
Natural gas consumption | 22.6 billion cu m (2005 est.) |
|
Natural gas exports | 0 cu m (2004 est.) |
|
Natural gas imports | 21.73 billion cu m (2004 est.) |
|
Natural gas proved reserves | 8.495 billion cu m (1 January 2005 est.) |
|
Current account balance | -$25.99 billion (2006 est.) |
|
Exports | $85.21 billion f.o.b. (2006 est.) |
|
Exports commodities | apparel, foodstuffs, textiles, metal manufactures, transport equipment |
|
Exports partners | Germany 11.4%, UK 8%, Italy 7.9%, US 5.9%, France 5.4%, Spain 4.3% (2006) |
|
Imports | $120.9 billion f.o.b. (2006 est.) |
|
Imports commodities | machinery, chemicals, semi-finished goods, fuels, transport equipment |
|
Imports partners | Russia 12.7%, Germany 10.6%, China 7%, Italy 6.3%, France 4.8%, US 4.3%, Iran 4.1% (2006) |
|
Reserves of foreign exchange and gold | $53.42 billion (2006 est.) |
|
Debt external | $193.6 billion (30 June 2006 est.) |
|
Economic aid recipient | ODA, $635.8 million (2002) |
|
Currency code | Turkish lira (TRY); old Turkish lira (TRL) before 1 January 2005 |
|
Exchange rates | Turkish liras per US dollar - 1.4286 (2006), 1.3436 (2005), 1.4255 (2004), 1.5009 (2003), 1.5072 (2002)
note: on 1 January 2005 the old Turkish lira (TRL) was converted to new Turkish lira (TRY) at a rate of 1,000,000 old to 1 new Turkish lira |
|
| Communications - Turkey: |
| Transportation - Turkey: |
| Military - Turkey: |
This page was last updated on 16 September, 2007


